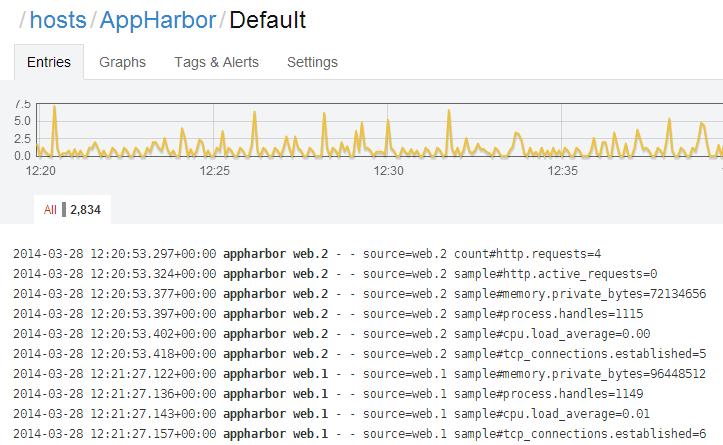
We host a number of sites with AppHarbor and recently enabled the performance metrics logging feature for a couple of our apps. This makes the webservers running your application publish perfomance information to your stdout every 20 seconds and can be observed in an app harbor logging session. The fields include:
- http.active_requests
- memory.private_bytes
- process.handles
- cpu.load_average
- tcp_connections.established
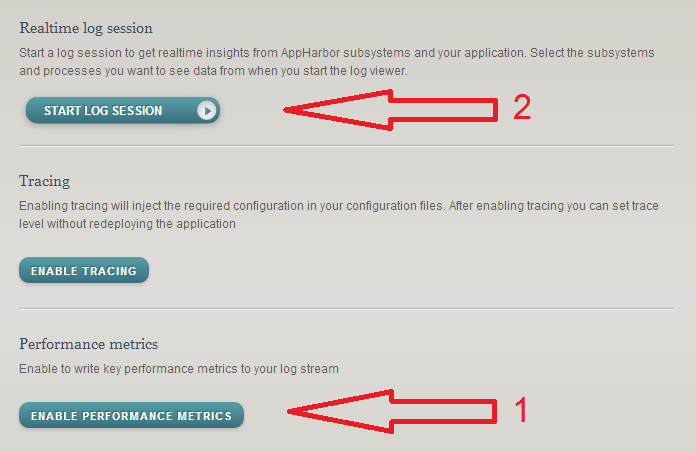
This can be useful to glance at, but would be much better as a graph. Enter the LogEntries add-on. LogEntries is a SAAS for log consumption and is a must have for diagnostics in an otherwise black-box set up. Just by enabling the LogEntries App Harbor add-on you get your app’s stdout immediately piped into a LogEntries Log. This lets you keyword search and review logs by date/time all in your browser. You should be able to see the appharbor performance metrics coming through under the Host named AppHarbor and the Log named Default.
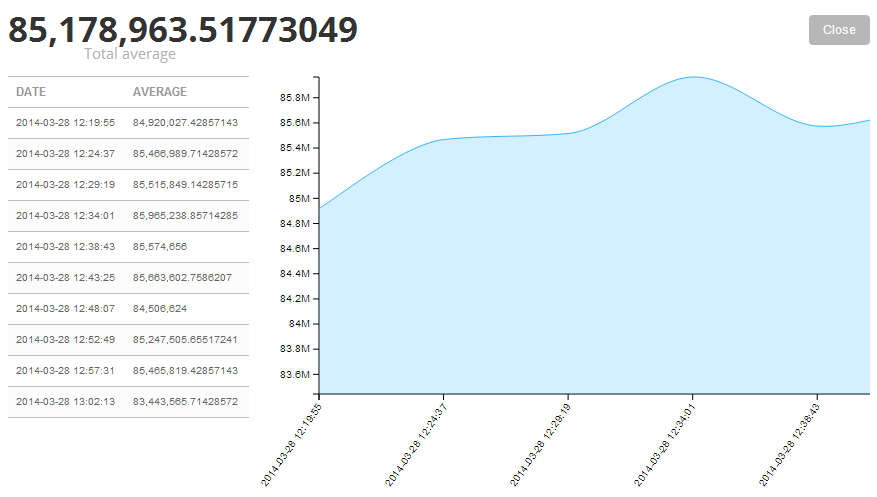
In order to visualise this information, we need to use a particular query in the LogEntries search box. First, choose your date range with the date picker or highlight the area of the graph you want to examine. Then, in the search box, we specifiy the search criteria and the operation we wish to perform on the result set. For example, to see how much memory our application is using we use the following:
memory.private_bytes>0 | AVERAGE
And hey presto, a graph of your performance metric:
The query can be extended to include AND operators for key-value pairs within the same log line. For example, we have 2 web servers hosting our application. AppHarbor is kind enough to include the webserver name when the perfomance metrics are published. This give us the ability to analyse one server at a time:
source=web.1 AND memory.private_bytes>0 | AVERAGE
This type of aggregation can be performed on any log, not just the Default AppHarbor one. Any numerical data that follows a key value pair format can be analysed. For example, in a custom log of ours we are measuring the average latency of a third-party service by writing out the following entries to the log and using the corresponding query:
Log: response_time=2.34
Query: response_time>0 | AVERAGE
Please see my previous post for more information on configuring AppHarbor and LogEntries.